
|
COVID-19
(Data - ONS)
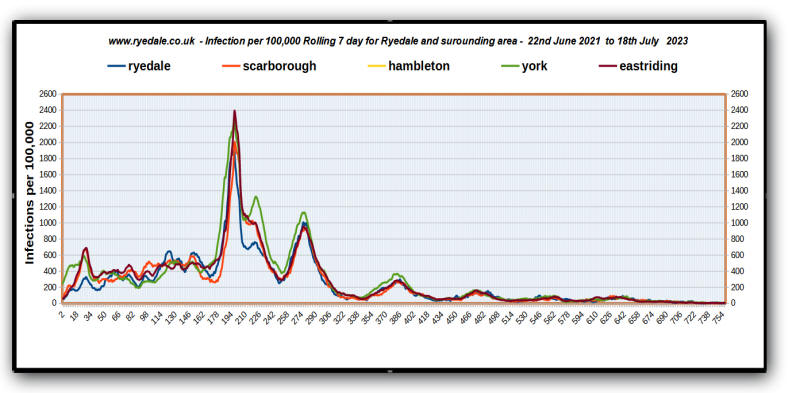
(Infection Rate Rolling 7 Day Per 100,000) The ONS no longer produce data from regional areas and have replaced the 'Covid Dashboard' with https://ukhsa-dashboard.data.gov.uk/ This new resource covers all respiratory illnesses and not just Covid. It is therefor not possible to carry on updating and producing the graph below which shows Covid levels in Ryedale and the four surrounding areas.
 How are the numbers calculated We can only assume that since the free LFT tests finished, the figures are still accurate. These figures are as a result of adding the infections for a rolling 7 days and then multiplying by the population of the area. So with a population of Ryedale at 55,000 we then calculation the rate PER 100,000. So that is sum of 7days divided by 55 and times 100. |